Data exploration
Profiling
install using conda install -c anaconda pandas-profiling
import pandas_profiling
pandas_profiling.ProfileReport(df)#.to_file(outputfile="output.html")
Correlation matrix
import matplotlib.pyplot as plt
import seaborn as sns
import numpy as np
import pandas as pd

df = sns.load_dataset('titanic')

corr = df.corr()
top_right_triangle = np.triu_indices_from(corr)
corr.values[top_right_triangle] = np.abs(corr.values[top_right_triangle])

fig = plt.figure(figsize=(7, 5.5))
sns.heatmap(corr, annot=True, vmin=-1, vmax=1,
            cmap=sns.diverging_palette(200, 15, as_cmap=True))

corr['survived'].to_frame()[1:].T


Crosstab
import seaborn as sns
df = sns.load_dataset('titanic')
survived_count = pd.crosstab(index=[df.sex], columns=[df.survived])

fig, ax = plt.subplots(1, figsize=(6,4))
survived_count.plot.bar(stacked=False, ax=ax)

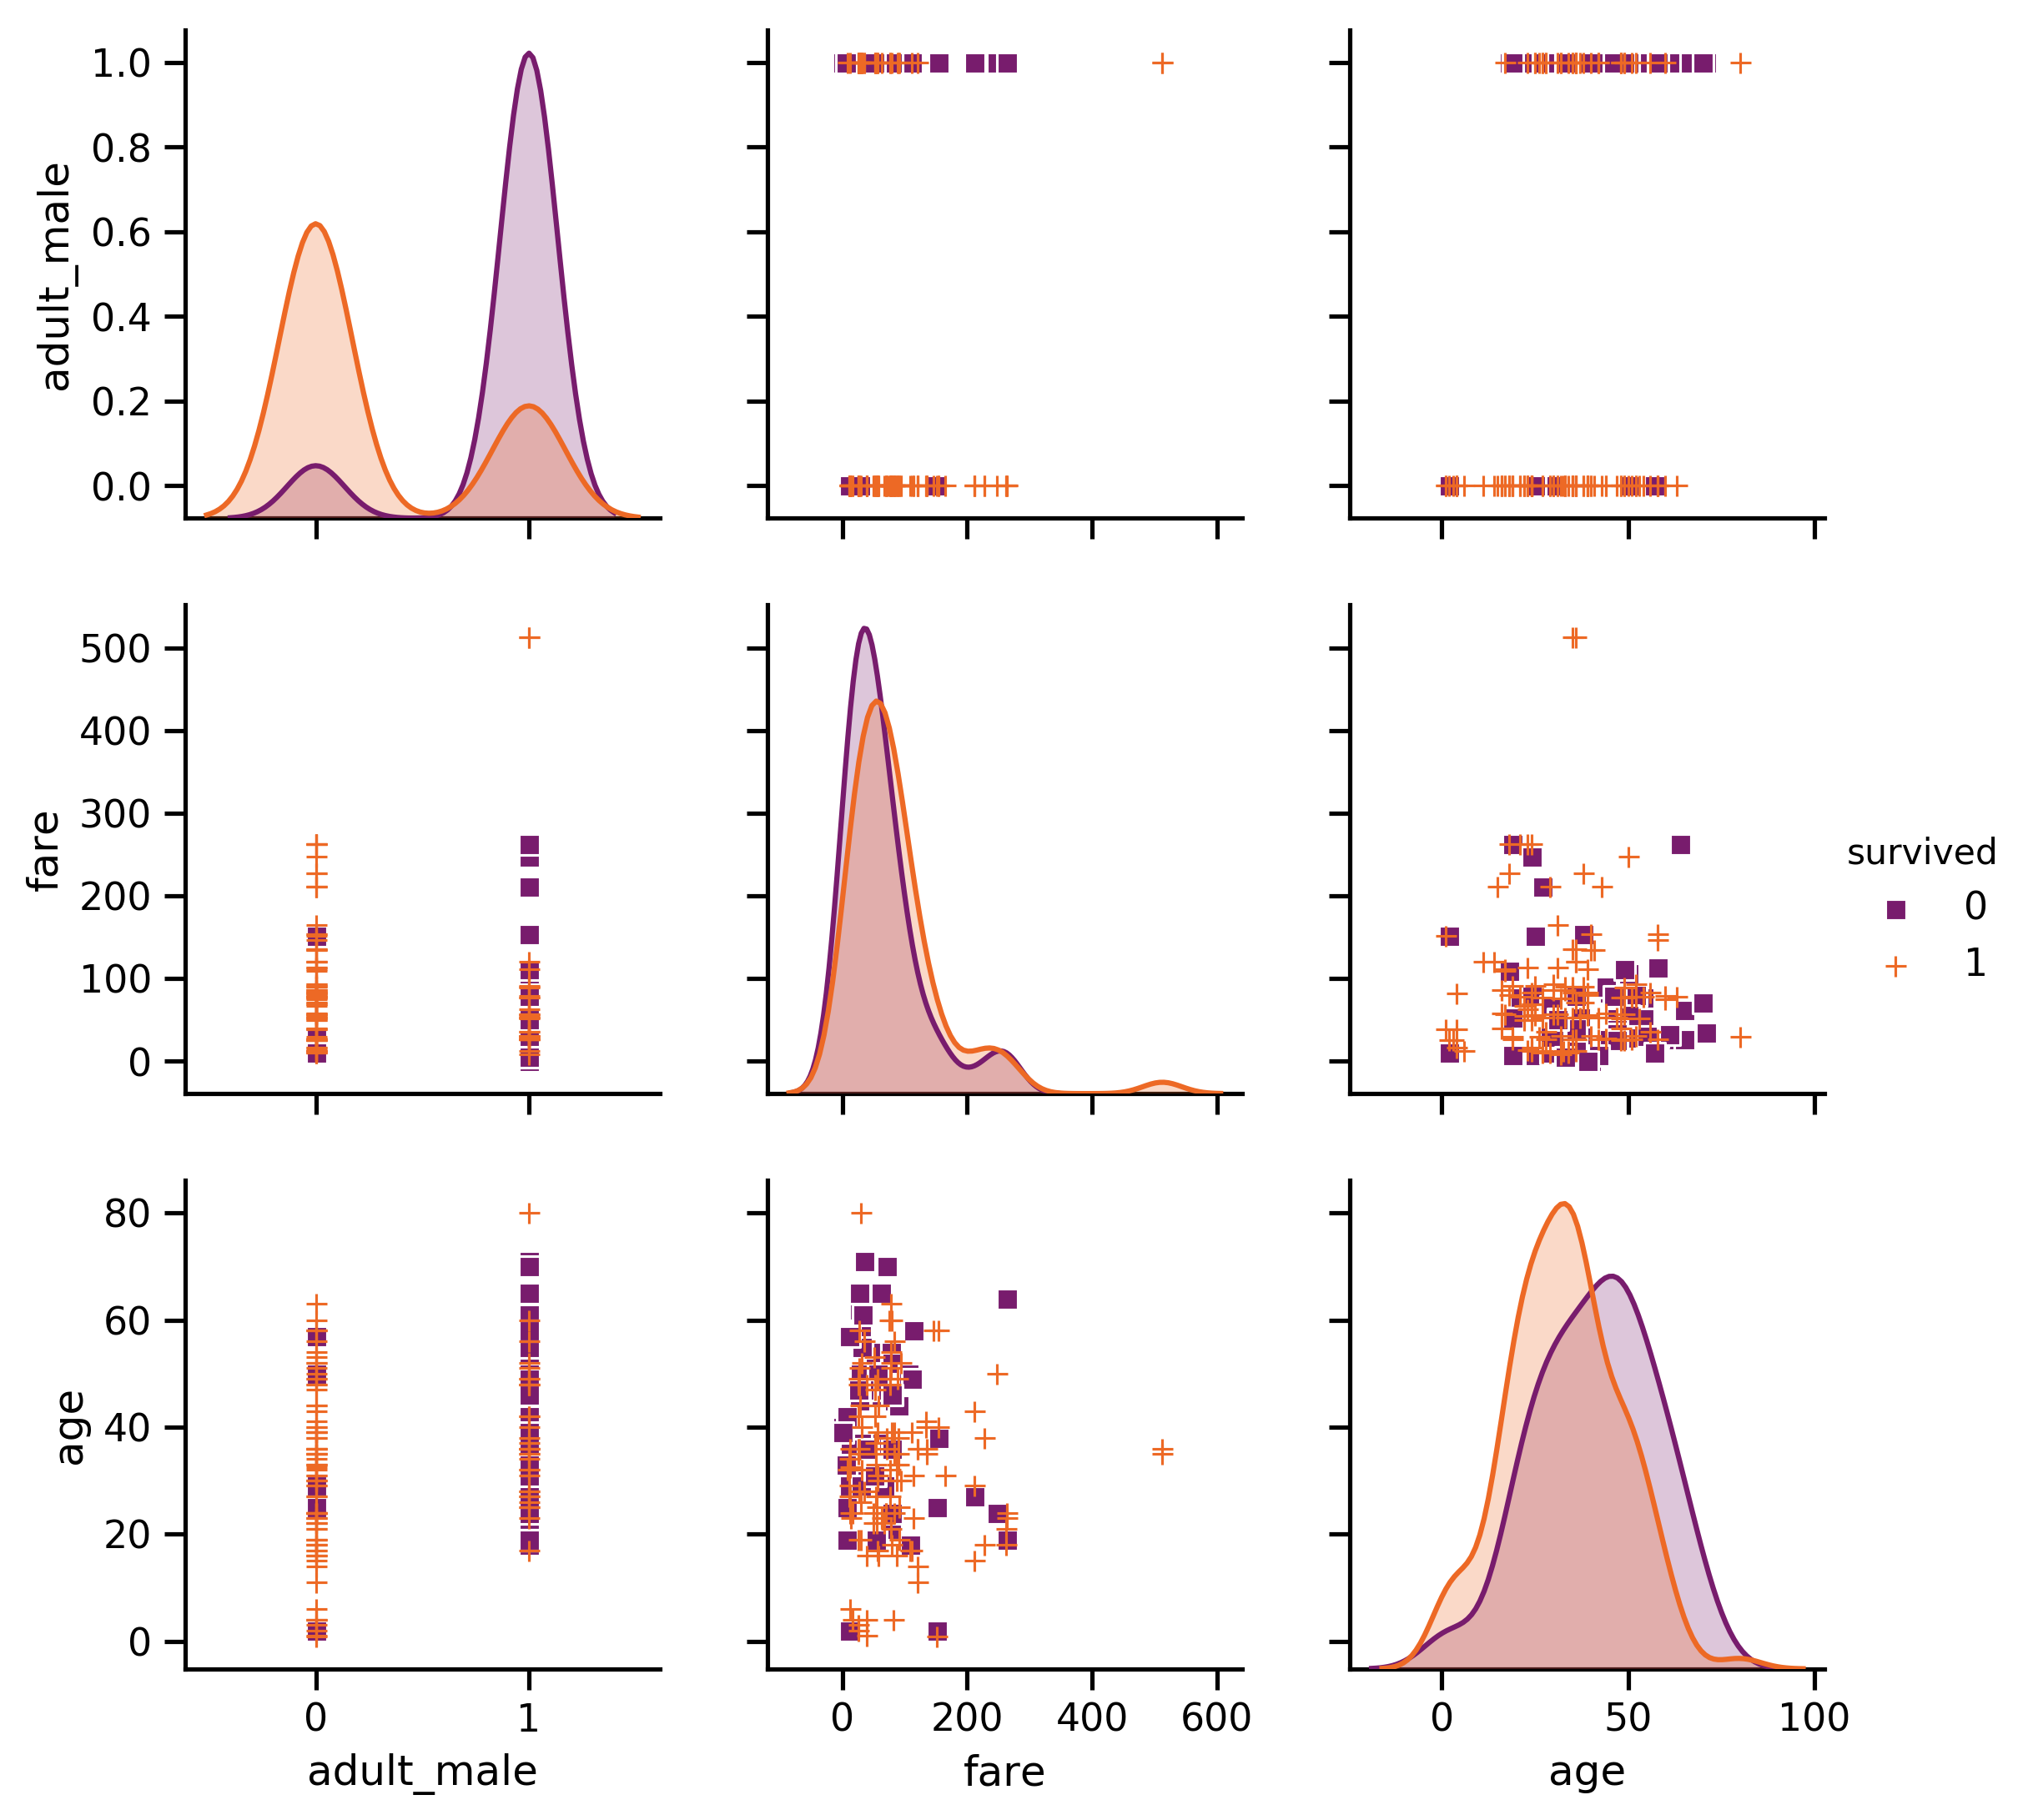
Pairplot
import seaborn as sns
df = sns.load_dataset('titanic').dropna()

ax = sns.pairplot(df, vars=['age', 'fare', 'pclass'], hue='survived',
            palette='inferno', kind='scatter', diag_kind='kde', markers=['s', '+'])

ax.fig.savefig('pairplot.png', bbox_inches='tight', dpi=300)