Pandas groupby
Here we show a few examples of how to use the pandas groupby function to:
- Filter data: select groups with given characteristics
- Transform data: add a new column based on group characteristics (e.g. normalization within groups)
- Aggregation: calculate aggregative quantities for each group
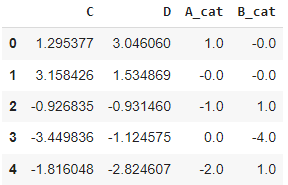
All the examples are based on a dummy dataset like the following one: A_cat and B_cat are categorical variables, while C and D are numerical. The code to generate the dummy dataset can be found at the bottom of the page.
Filtering
Select data such that grouping by A_cat will result in groups of 20 or more elements:
df = df.groupby('A_cat').filter(lambda df:len(df)>=20)
Select data such that grouping by B_cat will result in groups having low standard dev on variable C:
df = df.groupby('B_cat').filter(lambda df:df.C.std() < 2)
Transformations
Create column C_std storing the standard dev of variable C withing the B_cat groups:
df = df.assign(C_std = lambda df:df.groupby('B_cat').C.transform('std'))
Aggregations
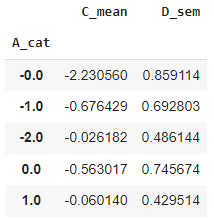
Aggregate A_cat groups by calculating the mean of the C columns and the standard error of the mean of the D column:
df.groupby('A_cat').agg(
    C_mean = ('C', np.mean),
    D_sem = ('D', 'sem')
)
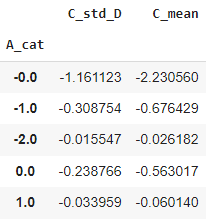
For custom aggregations, which need mixing more columns we can use the apply function:
def custom_agg(df):
    C_mean = df.C.mean()
    D_std = df.D.std()
    return pd.Series(dict(
        C_std_D = C_mean/D_std,
        C_mean = C_mean
    ))

df.groupby('A_cat').apply(custom_agg)
Utilities
df.groupby('A_cat').ngroups           # get number of groups
df.groupby('A_cat').groups            # get dictionary of data grouped
df.groupby('A_cat').size()            # get the size of each group
df.groupby('A_cat').groups.keys()     # get the groups name
df.groupby('A_cat').get_group('1.0')  # get a single group by name
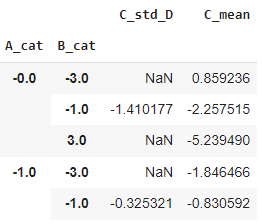
Multiple grouping
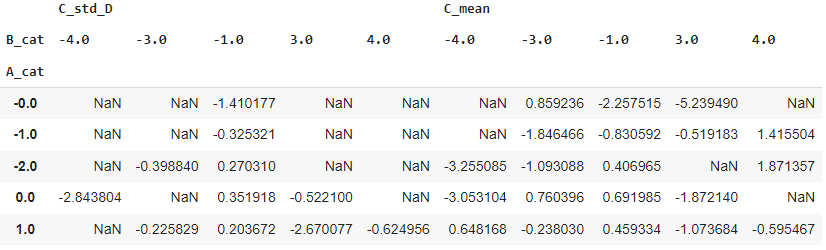
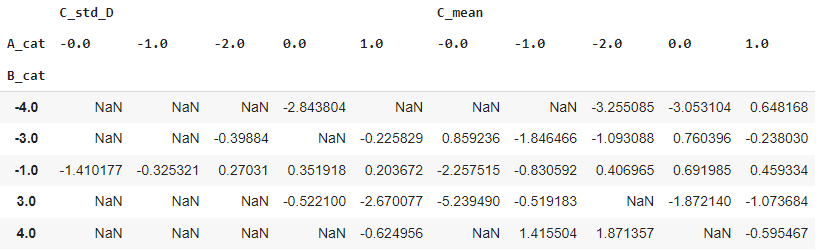
df.groupby(['A_cat', 'B_cat']).apply(custom_agg).head()
df.groupby(['A_cat', 'B_cat']).apply(custom_agg).unstack().head()
df.groupby(['A_cat', 'B_cat']).apply(custom_agg).swaplevel(axis='index').unstack().head()
Grouping using index
The grouping can be based on the dataframe index by using a mapping function:
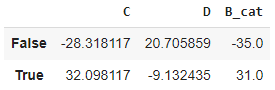
df.groupby(lambda idx: (idx%3)==True).sum()
Grouping using bins
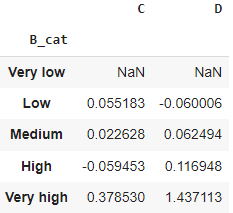
Grouping can be performed using a list of labels (sharing same len with dataframe). E.g. one can bin the data using the pandas cut function.
df.groupby(pd.cut(df.B_cat,
                  np.linspace(-8, 8, 6),
                  labels=['Very low', 'Low', 'Medium', 'High', 'Very high'])
            )[['C', 'D']].mean()
Create a dummy dataset
import pandas as pd
import numpy as np

np.random.seed(42)
df = pd.DataFrame(np.random.normal(0, 2, size=(200,4)), columns=['A', 'B', 'C', 'D'])

df = (df
        .assign(A_cat = lambda df: np.round(df.A).astype('str')).drop('A', axis=1)
        .assign(B_cat = lambda df: np.round(df.B)).drop('B', axis=1)
)

df.head()