Chow: find discontinuity in linear data
A simple method to test the presence and locate a discontinuity in a linear trend is to exploit the Chow statistics (see wiki). The idea is the following: we split the dataset into two chunks by cutting it along the x-axis (multiple times). We separately perform linear fits on the two subsets and we compare the residuals to the residuals obtained via a single linear fit on the full dataset, obtaining the Chow coefficient. As we can see in the following animation, if there is a discontinuity in data, it will be highlighted by a higher Chow coefficient.
Code
Here is the code to find the maximum Chow coefficient in a given dataset. Note that we can change the cuts_num argument to increase and decrease the number of cuts in the dataset. The function find_max_chow also returns information about the linear fits corresponding to the cut location of the max Chow coefficient found.
import numpy as np

def linear_fit_param(x, y):
    """Perform linear fit on x-y data and returns slope, offset and residuals"""
    Ax = np.vstack([x, np.ones(len(x))]).T
    (slope, off), res, *_ = np.linalg.lstsq(Ax, y, rcond=None)
    return (slope, off, res[0])

def get_chow_test_statistics(x1, y1, x2, y2, res_tot):
    """Calculate the Chow coefficient given two segments (x1-y1 x2-y2) and
    the residuals of a linear fit performed on the full segment ([x1,x2] - [y1,y2])
    """
    _, _, res_1 = linear_fit_param(x1, y1)
    _, _, res_2 = linear_fit_param(x2, y2)

    chow_nom = (res_tot - (res_1 + res_2)) / 2
    chow_denom = (res_1 + res_2) / (len(y1) + len(y2) - 4)
    return chow_nom / chow_denom

def find_max_chow(x, y, cuts_num=30, min_points=5):
    """Given a dataset x-y finds the max Chow coefficient splitting the dataset into two different segments
    `cuts_num` times, considering a minimum of `min_points` for a single segment.
    Returns the max Chow coefficient and the fitting information corresponding to the max Chow data split.
    """
    x, y = zip(*sorted(zip(x, y), key=lambda x: x[0]))

    x_cut_list = np.unique(np.linspace(0, len(x), cuts_num).astype('int')[min_points:-min_points])
    chow_array = np.zeros_like(x_cut_list)

    slope_tot, off_tot, res_tot = linear_fit_param(x, y)
    for index, x_cut in enumerate(x_cut_list):
        chow_array[index] = get_chow_test_statistics(x[:x_cut], y[:x_cut], x[x_cut:], y[x_cut:], res_tot)

    max_index = np.argmax(chow_array)
    x_cut_max_index = x_cut_list[max_index]

    slope_1, off_1, _ = linear_fit_param(x[:x_cut_max_index], y[:x_cut_max_index])
    slope_2, off_2, _ = linear_fit_param(x[x_cut_max_index:], y[x_cut_max_index:])

    fit_info = dict(
        x_cut_position = x[x_cut_max_index],
        slope_1 = slope_1,
        off_1 = off_1,
        slope_2 = slope_2,
        off_2 = off_2,
        slope_tot = slope_tot,
        off_tot = off_tot,
        delta_slope = slope_2 - slope_1,
        delta_y = (x[x_cut_max_index]*slope_2+off_2) - (x[x_cut_max_index-1]*slope_1+off_1)
    )
    return (chow_array[max_index], fit_info)
## Example
import matplotlib.pyplot as plt

## Create dummy datapoints
x_1 = np.random.uniform(0,5,40)
y_1 = x_1 * 0.3 + 8 + np.random.normal(loc=0, scale=2, size=len(x_1))
x_2 = np.random.uniform(5,10,40)
y_2 = x_2 * 0.3 - 0 + np.random.normal(loc=0, scale=2, size=len(x_2))
x_data = np.concatenate([x_1, x_2])
y_data = np.concatenate([y_1, y_2])

## Find max chow using fit_info
chow, fit_info = find_max_chow(x_data, y_data)

## Plot result using
fig, ax = plt.subplots(1, figsize=(6, 4))
ax.scatter(x_data, y_data)
xx_1 = np.linspace(np.min(x_1), fit_info['x_cut_position'], 100)
xx_2 = np.linspace(fit_info['x_cut_position'], np.max(x_2), 100)
yy_1 = fit_info['slope_1'] * xx_1 + fit_info['off_1']
yy_2 = fit_info['slope_2'] * xx_2 + fit_info['off_2']
ax.plot(xx_1, yy_1, label='segment 1')
ax.plot(xx_2, yy_2, label='segment 2')
ax.legend()
ax.set(xlim=(0,10), ylim=(-5, 15), xlabel='Independent variable', ylabel='Dependent variable');
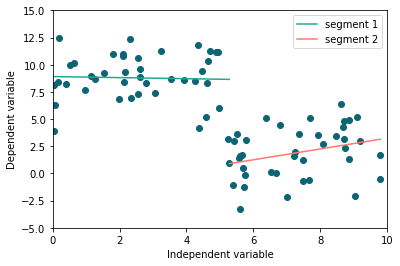
Here’s the fit_info content:
 {'delta_slope': -0.08266169591013839,
 'delta_y': -7.134722387034087,
 'off_1': 8.082278352912864,
 'off_2': 1.335932153868587,
 'off_tot': 10.306358145838905,
 'slope_1': 0.25244503819910913,
 'slope_2': 0.16978334228897074,
 'slope_tot': -0.9272940623397588,
 'x_cut_position': 5.176520171495405}