Live update jupyter plot
import matplotlib.pyplot as plt
from IPython.display import display, clear_output
%matplotlib inline
fig, ax = plt.subplots(1, figsize=(6, 6))

for _ in range(100):
    ax.cla()

    # ax.plot your things here

    display(fig)
    clear_output(wait=True)
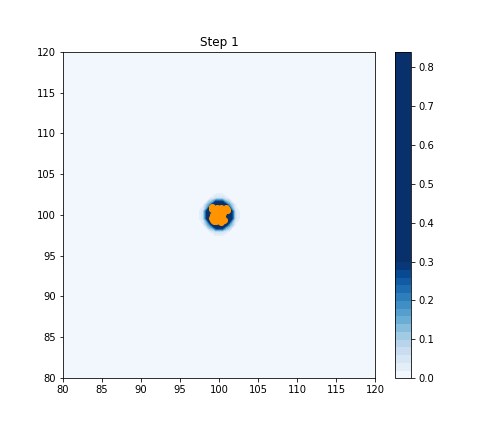
2D random walk example
Lets see a concrete example simulating a simple 2D random walk:
import numpy as np
import matplotlib.pyplot as plt
from IPython.display import display, clear_output
%matplotlib inline
np.random.seed(42)

def probability(XY, N):
    radius= np.sqrt((XY[0]-100)**2 + (XY[1]-100)**2)
    return 2*radius/N * np.exp(-radius**2/N)

NBALLS = 30
NSTEPS = 100
balls = np.ones([NBALLS,2])*100


fig, ax = plt.subplots(1, figsize=(7, 6))
for step in np.arange(1, NSTEPS+1):
    ax.cla()
    balls = balls + np.random.uniform(-1, 1, balls.shape)
    x_grid = np.linspace(80, 120, 50)
    y_grid = np.linspace(80, 120, 50)

    XY = np.meshgrid(x_grid, y_grid)

    cf = ax.contourf(x_grid, y_grid, probability(XY, step), 50, cmap='Blues', vmin=0, vmax=0.3)


    color = (np.array([1, 0.6, 0])*np.exp(-step/30) + np.array([1, 0, 0])*(1-np.exp(-step/30)))
    for ball in balls:
        ax.scatter(ball[0], ball[1], color=color)

    ax.set_xlim(80, 120)
    ax.set_ylim(80, 120)
    ax.set_title(f'Step {step}')
    if step==1: fig.colorbar(cf)

    display(fig)
    clear_output(wait=True)
    #fig.savefig(f'imgs/img{step}.png')