Matplotlib
My colors
from cycler import cycler
colors = ['#0c6575', '#bbcbcb', '#23a98c', '#fc7a70','#a07060',
          '#003847', '#FFF7D6', '#5CA4B5', '#eeeeee']
plt.rcParams['axes.prop_cycle'] = cycler(color = colors)
Plots
plt.axis('off')
plt.close()

for ax in fig.axes:
    ax.set_xticks([])
    ax.set_yticks([])


ax.fig.savefig('./figurename.png', bbox_inches='tight', dpi=300)
Remove stuff
fig, ax = plt.subplots(1, figsize=(8, 1.5))
ax.barh(range(5), np.random.random(5), height=0.6, color=colors)

## remove spines
[ax.spines[pos].set_visible(False) for pos in ('right', 'left', 'bottom', 'top')];
ax.set_axis_off()

## remove ticks and ticklabels
[tl.set_color('none') for tl in ax.get_yticklines()];
[mt.set_color('none') for mt in ax.get_xmajorticklabels()];

## custom label and colors
[mt.set_color(color) for mt, color in zip(ax.get_ymajorticklabels(), colors)];
ax.set(yticks=range(5), yticklabels=['I', 'II', 'III', 'IV', 'V']);

Rotate tick labels
ax.tick_params(axis='x', labelrotation=45)
Padding ticks and labels
ax.tick_params(axis='x', direction='out', pad=-3)
ax.xaxis.labelpad = 5
Plot, scatter and errorbar
from sklearn.datasets import load_iris
iris_dataset = load_iris()

y = iris_dataset.data.mean(1)
x = np.linspace(1, 30, y.shape[0])

fig, (ax_plot, ax_scatter, ax_errorbar) = plt.subplots(1, 3, figsize=(12,3))

ax_plot.plot(x, y,
    color=color(0),
    linestyle='-',
    linewidth=1,
    markevery=10,
    marker='o',
    drawstyle='steps',
    fillstyle='bottom',
    markersize=15,
    markerfacecolor=color(1),
    markeredgecolor=color(2))

ax_scatter.scatter(x, y,
    c=iris_dataset.target,
    cmap=plt.cm.viridis,
    s=np.power(x, 2),
    edgecolors='#444444',
    marker='X')

df_iris = pd.DataFrame(y, columns=['data'])
df_iris['target'] = iris_dataset.target
RESAMPLE_BIN_SIZE = 10
df_iris_mean = df_iris.reset_index(drop=True).groupby(
    by=lambda x: int(x/RESAMPLE_BIN_SIZE), axis=0).mean()
df_iris_std = df_iris.reset_index(drop=True).groupby(
    by=lambda x: int(x/RESAMPLE_BIN_SIZE), axis=0).std()

ax_errorbar.errorbar(
    x=df_iris_mean.index,
    y=df_iris_mean.data.values,
    yerr=df_iris_std.data.values,
    fmt='H',
    c=color(2),
    ecolor=color(5),
    capsize=2,
    barsabove=False,
    errorevery=1,
    markersize=10,
    markeredgecolor=color(5),
    markeredgewidth=1)

for ax in fig.axes:
    ax.set_xticks([])
    ax.set_yticks([])

plt.tight_layout()
fig.savefig('./basic_plots.svg', bbox_inches='tight')

Dimensionality reduction
from sklearn.datasets import load_iris
from sklearn.decomposition import PCA
from sklearn.manifold import TSNE
import matplotlib.pyplot as plt
import numpy as np

from cycler import cycler
colors = ['#0c6575', '#bbcbcb', '#23a98c', '#fc7a70','#a07060',
          '#003847', '#FFF7D6', '#5CA4B5', '#eeeeee']
plt.rcParams['axes.prop_cycle'] = cycler(color = colors)


iris_dataset = load_iris()
X = iris_dataset.data
y = iris_dataset.target
y_names = {0:'setosa', 1:'versicolor', 2:'virginica'} # optional, None is fine


X_TSNE = TSNE(n_components=2, random_state=1).fit_transform(X)
X_PCA = PCA(n_components=2).fit_transform(X)


fig, (ax_pca, ax_tsne) = plt.subplots(1, 2, figsize=(10, 4))

for y_class in np.unique(y):
    marker = f'${y_class}$'
    class_mask = (y == y_class)

    ax_tsne.scatter(X_TSNE[class_mask, 0], X_TSNE[class_mask, 1],
              marker=marker, color=colors[y_class],
              label=y_names[y_class] if y_names else f'${y_class}$')
    ax_pca.scatter(X_PCA[class_mask, 0], X_PCA[class_mask, 1],
              marker=marker, color=colors[y_class])

ax_pca.set_title('PCA', color=colors[5])
ax_tsne.set_title('t-SNE', color=colors[5])

ax_tsne.legend(loc='lower left', bbox_to_anchor=(-1, 0.1), ncol=3,
    scatterpoints=3, frameon=True, fancybox=True, framealpha=0.2,
    facecolor=colors[1], edgecolor=colors[0])

ax_pca.axis('off')
ax_tsne.axis('off')
plt.subplots_adjust(left=None, bottom=None, right=None, top=None,
    wspace=1, hspace=None)

fig.savefig('./plots/dimensionality_reduction.svg', bbox_inches='tight')

Coloreful axes
# left=None, bottom=None, right=None, top=None, wspace=None,
# hspace=None, width_ratios=None, height_ratios=None
fig, (ax1, ax2) = plt.subplots(1, 2, figsize=(10,3),
    sharey=True, gridspec_kw={'width_ratios':[1,2]})

ax1.set_xlabel('Small label')
ax1.set_ylabel('y label')

ax2.set_xlabel('Large label', size=14)

ax1.spines['top'].set_color('orange')
ax2.spines['right'].set_color('orange')

ax1.tick_params(axis='y', colors='green')
ax2.tick_params(axis='x', colors='red')

ax1.yaxis.label.set_color('purple')
ax2.xaxis.label.set_color('blue')

ax2.grid(alpha=0.4)

fig.savefig('./plots/grid_spec.svg', bbox_inches='tight')

Text
fig, ax = plt.subplots(1, figsize=(12,2))
x = np.linspace(0.1, 0.9, 6)
y = np.cos(x * 101)

ax.text(x[0], y[0], 'Simple text')
ax.text(x[1], y[1], 'Alignement', horizontalalignment='right', verticalalignment='top')
ax.text(x[2], y[2], 'Rotation', rotation=75, rotation_mode='anchor')
ax.text(x[3], y[3], 'BIG IMPACT', fontsize=20, fontfamily='Impact', color=color(2))
ax.text(x[4], y[4], '$\\Delta$ LaTeX is fine')
ax.text(x[5], y[5], 'bbox', bbox=dict(boxstyle='Round', edgecolor=color(0), facecolor=color(8), pad=0.8))

[ax.spines[pos].set_color('#aaaaaa') for pos in ax.spines]
ax.plot(x, y, '+', color='gray', markersize=6)
ax.set(xlim=[0, 1], ylim=[-1.3, 1.3], xticks=[], yticks=[])

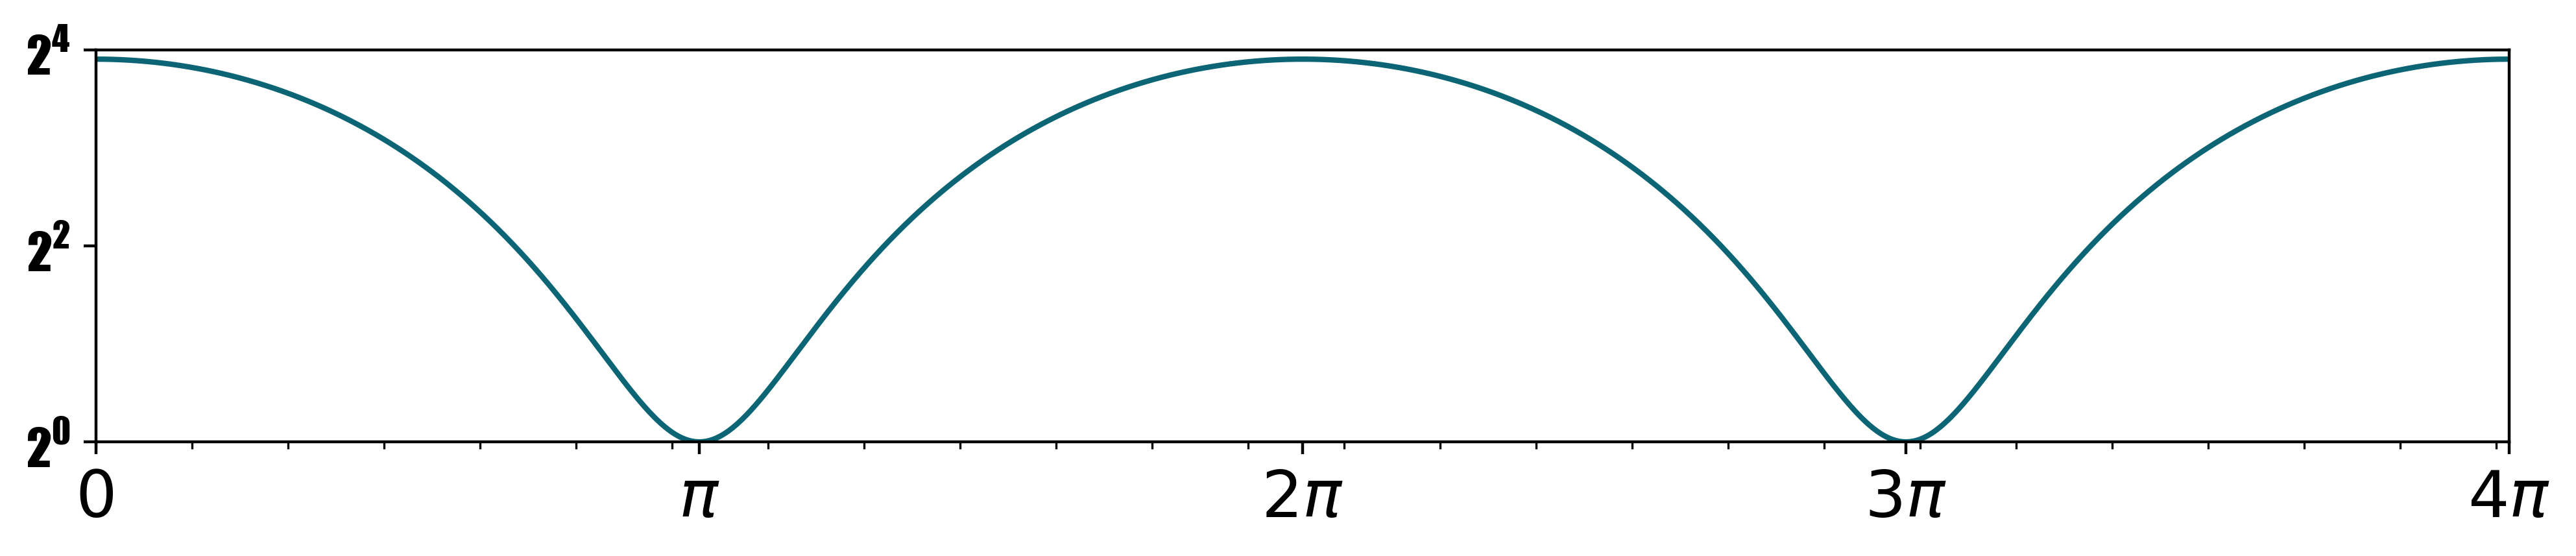
Ticks and locators
fig, ax = plt.subplots(1, figsize=(12,2))
x = np.linspace(0, np.pi*4, 2000)
plt.plot(x, np.cos(x)*7+8, color=color(0))
ax.set_xlim(0.0, np.pi*4)
ax.set_ylim(1, 16)

########################################## X AXIS
for label in (ax.get_xticklabels()):
    label.set_fontsize(18)

import matplotlib.ticker as ticker
ax.xaxis.set_major_locator(ticker.MultipleLocator(np.pi))
ax.xaxis.set_minor_locator(ticker.MultipleLocator(0.5))
ax.set_xticks(np.linspace(0, np.pi*4, 5))
ax.set_xticklabels([0, '$\\pi$', '$2\\pi$', '$3\\pi$', '$4\\pi$'])

########################################## Y AXIS
for label in (ax.get_yticklabels()):
    label.set_fontname('Impact')
    label.set_fontsize(14)

ax.set_yscale('log', basey=2)
ax.yaxis.set_major_locator(ticker.LogLocator(base=4))
3D plots
from mpl_toolkits.mplot3d import Axes3D
from scipy import ndimage
from matplotlib.patches import Rectangle
import mpl_toolkits.mplot3d.art3d as art3d

################## CREATE NICE LOOKING FIELD  #########################
np.random.seed(0)
X_SIZE, Y_SIZE = 150, 30
field = (np.random.uniform(-0.5, 0.5, size=[Y_SIZE*10, X_SIZE*10]))
field = ndimage.gaussian_filter(field, 25)
field = field.reshape(Y_SIZE, 10, X_SIZE, 10).sum(3).sum(1) #binning
field = field - np.ones(field.shape)*np.arange(field.shape[1])*0.02

yx = np.mgrid[:Y_SIZE, :X_SIZE]
x, y, z = yx[1].flatten(), yx[0].flatten(), field.flatten()
#######################################################################


fig = plt.figure(figsize=(8, 6))
ax = fig.gca(projection='3d', proj_type='ortho', azim=-20, elev=40)

# Rectangle patch
rect_patch = Rectangle([0, 1.5], 30, 0.5, color=(0.5,0.7,0.5,0.1))
ax.add_patch(rect_patch)
art3d.pathpatch_2d_to_3d(rect_patch, z=0, zdir="x")

ax.plot_trisurf(x, y, z, linewidth=0, antialiased=True, cmap='Greens_r',
                shade=True, alpha=0.6, zorder=3, vmin=-4, vmax=2)
ax.set(xlim3d=(0, 150), ylim3d=(0, 30), xticks=[], yticks=[], zticks=[])


# Set spines colors (alpha channel to remove)
ax.w_xaxis.line.set_color('red')
ax.w_yaxis.line.set_color('green')
ax.w_zaxis.line.set_color('blue')

# Set panes color
ax.w_xaxis.set_pane_color((1.0, 1.0, 1.0, 0.0))
ax.w_yaxis.set_pane_color((0.5,0.5,1,0.1))
ax.w_zaxis.set_pane_color((0.95, 0.95, 0.95, 1))

# ax.yaxis.pane.fill = False
# ax.xaxis.pane.fill = False
ax.grid(None)
