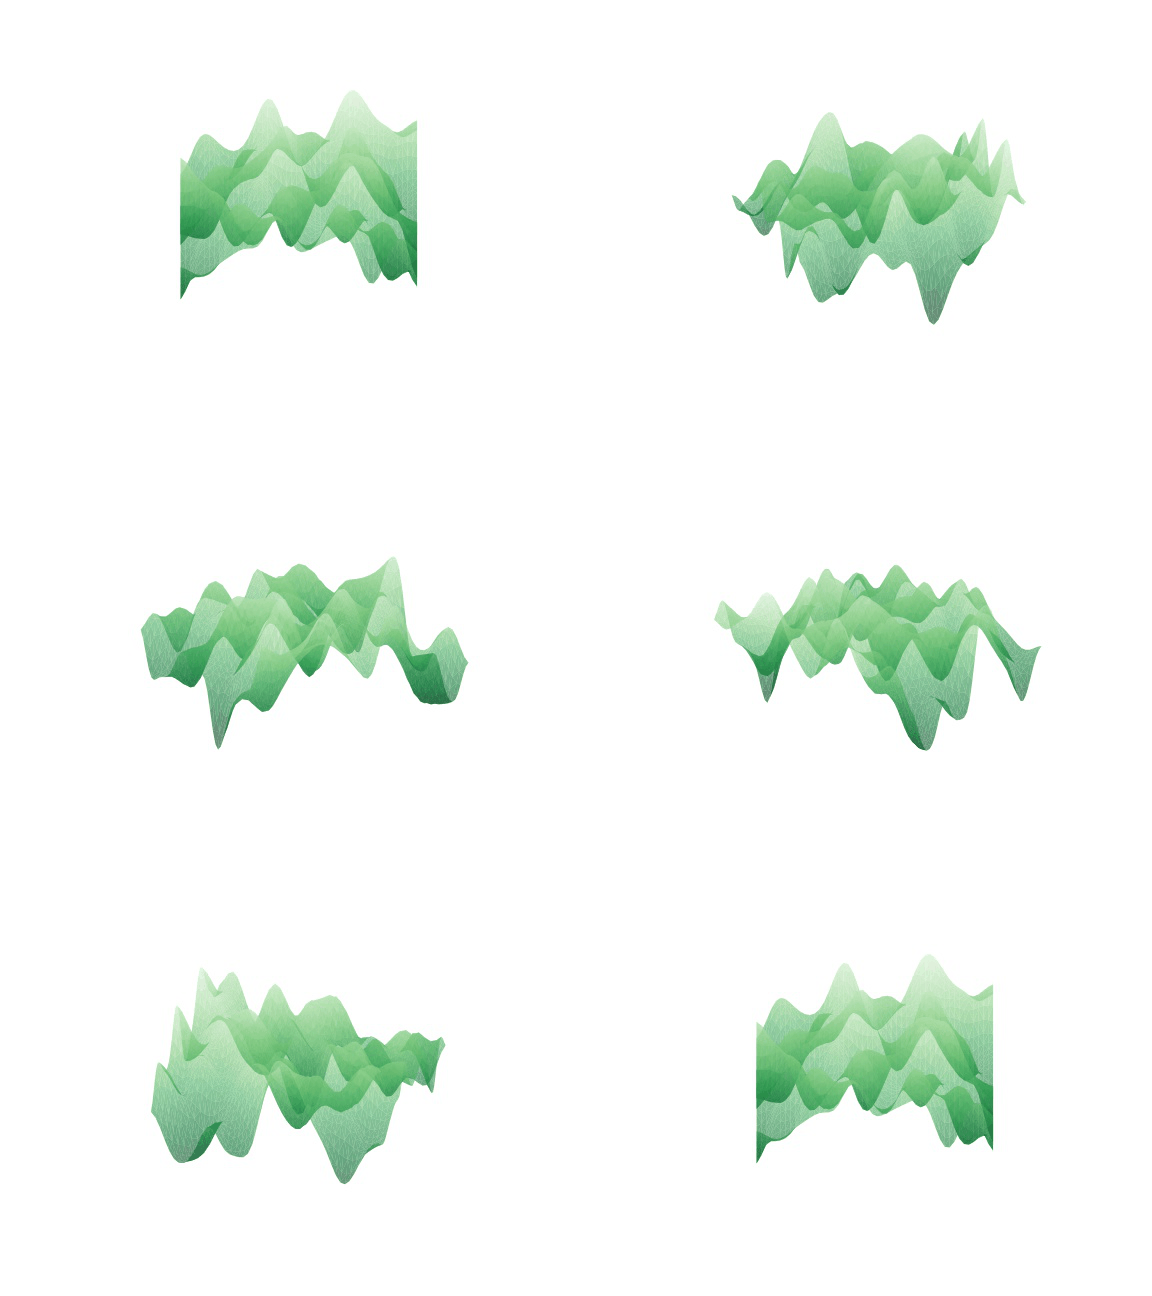
Matplotlib gif animation
Simple API for creating gif animation using matplotlib and imageio.
Gif maker class definition
import numpy as np
import matplotlib.pyplot as plt
import os, imageio.v2 as imageio

class Gif_maker(object):
    def __init__(self, buffer_folder='./buffer-gif-maker', fps=10, palettesize=256):
        if not os.path.exists(buffer_folder):
            os.makedirs(buffer_folder)
        self.image_list = []
        self.image_index = 0
        self.buffer_folder = buffer_folder
        self.palettesize = palettesize
        self.fps = fps

    def snap(self, figure):
        image_name = f'{self.buffer_folder}/temp_img_{self.image_index}.jpg'
        figure.savefig(image_name)
        self.image_list.append(image_name)
        self.image_index += 1

    def save(self, output_file='./animation.gif'):
        images = [imageio.imread(file_path) for file_path in self.image_list]
        imageio.mimwrite(output_file, images, fps=self.fps, palettesize=self.palettesize)
        for file_path in self.image_list:
            os.remove(file_path)
        if '.ipynb_checkpoints' in os.listdir(self.buffer_folder):
            os.rmdir(f'{self.buffer_folder}/.ipynb_checkpoints')
        if len(os.listdir(self.buffer_folder))==0:
            os.rmdir(self.buffer_folder)
Usage
gm = Gif_maker()

fig, ax = plt.subplots(1, figsize=(5,5))

for i in range(10):

	## PLOT HERE USING THE AXIS ax

    gm.snap(fig) # take the snapshot of the figure
    ax.cla() # clear the axis for the next gif frame
plt.close()

gm.save(output_file='./my_animation.gif') # save the gif
Example
Here we show how to create a gif of a rotating 3d object.
from mpl_toolkits.mplot3d import Axes3D
from scipy import ndimage
from matplotlib.patches import Rectangle
import mpl_toolkits.mplot3d.art3d as art3d

################## CREATE NICE LOOKING FIELD  #########################
np.random.seed(0)
X_SIZE, Y_SIZE = 50, 50
field = (np.random.uniform(-0.5, 0.5, size=[Y_SIZE*10, X_SIZE*10]))
field = ndimage.gaussian_filter(field, 25)
field = field.reshape(Y_SIZE, 10, X_SIZE, 10).sum(3).sum(1) #binning
yx = np.mgrid[:Y_SIZE, :X_SIZE]
x, y, z = yx[1].flatten(), yx[0].flatten(), field.flatten()
#######################################################################

fig = plt.figure(figsize=(8, 6))
gm = Gif_maker(fps=10)
ax = fig.gca(projection='3d', proj_type='ortho', azim=-20, elev=40)

for angle in np.linspace(0, 360, 60):
    ax.plot_trisurf(x, y, z, linewidth=0, antialiased=True, cmap='Greens_r',
                    shade=True, alpha=0.6, zorder=3, vmin=-1, vmax=1.5)
    ax.set(xlim3d=(0, 50), ylim3d=(0, 50), xticks=[], yticks=[], zticks=[])

    # Set spines colors (alpha channel to remove)
    ax.w_xaxis.line.set_color('none')
    ax.w_yaxis.line.set_color('none')
    ax.w_zaxis.line.set_color('none')

    # Set panes color
    ax.w_xaxis.set_pane_color((0,0,0,0))
    ax.w_yaxis.set_pane_color((0,0,0,0))
    ax.w_zaxis.set_pane_color((0,0,0,0))

    ax.yaxis.pane.fill = False
    ax.xaxis.pane.fill = False
    ax.grid(None)

    ax.view_init(30, angle)
    gm.snap(fig)
    ax.cla()
plt.close()

gm.save()
Finally we can show the result in a jupyter notebook or a Google Colab notebook:
from IPython.display import Image
Image(open('animation.gif','rb').read())
