ML Snippets
Shuffling and splitting
from sklearn.utils import shuffle
x, y = shuffle(x, y, random_state=42)

from sklearn.model_selection import train_test_split
df_train, df_test = train_test_split(df, test_size=0.2, random_state=42, shuffle=True)
X_train, X_test, y_train, y_test = train_test_split(X, y, test_size=0.2, random_state=42)

import numpy as np
indices = np.arange(data.shape[0])
np.random.shuffle(indices)
data = data[indices]
labels = labels[indices]
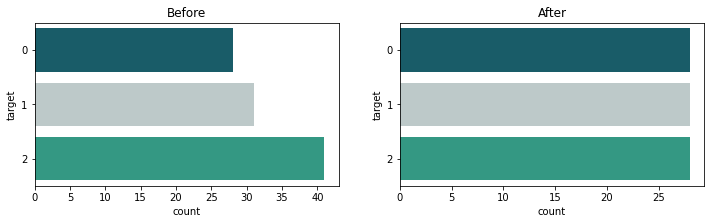
Balance a dataset
For training unbalanced dataset the siples solution is the reduce the size of the most populated classes to the size of the least populated:
import pandas as pd
import numpy as np

df = pd.DataFrame({'feature_1':np.random.choice([4,5], size=100),
                   'feature_2':np.random.random(size=100),
                   'target':np.random.choice([0,1,2], size=100)})

df_g = df.groupby(['target'])
df_bal = df_g.apply(lambda x: x.sample(df_g.size().min()).reset_index(drop=True))
Here’s a coutplot before and after the balancing:
import seaborn as sns
import matplotlib.pyplot as plt

fig, (ax0, ax1) = plt.subplots(1, 2, figsize=(12,3))
sns.countplot(data=df, y='target', ax=ax0).set_title('Before')
sns.countplot(data=df_bal, y='target', ax=ax1).set_title('After')
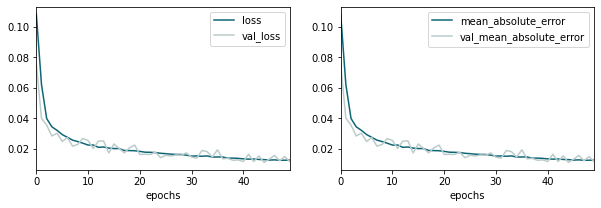
Plot training history metrics for tensorflow models
def plot_history(model):
    history = model.history.history
    history_keys = [h for h in history.keys() if not 'val' in h]
    n_axis = len(history_keys)
    fig, axs = plt.subplots(1, n_axis, figsize=(n_axis*5, 3))
    for ax, k in zip(axs, history_keys):
        ax.plot(history[k], label=k)
        ax.plot(history['val_'+k], label='val_'+k)
        ax.set(xlim=(0, len(history[k])-1), xlabel='epochs')
        ax.legend()

## example usage given a tf model:
## plot_history(model)